
Friday Finance: The Invisible Exchanges You’ve Probably Never Heard Of
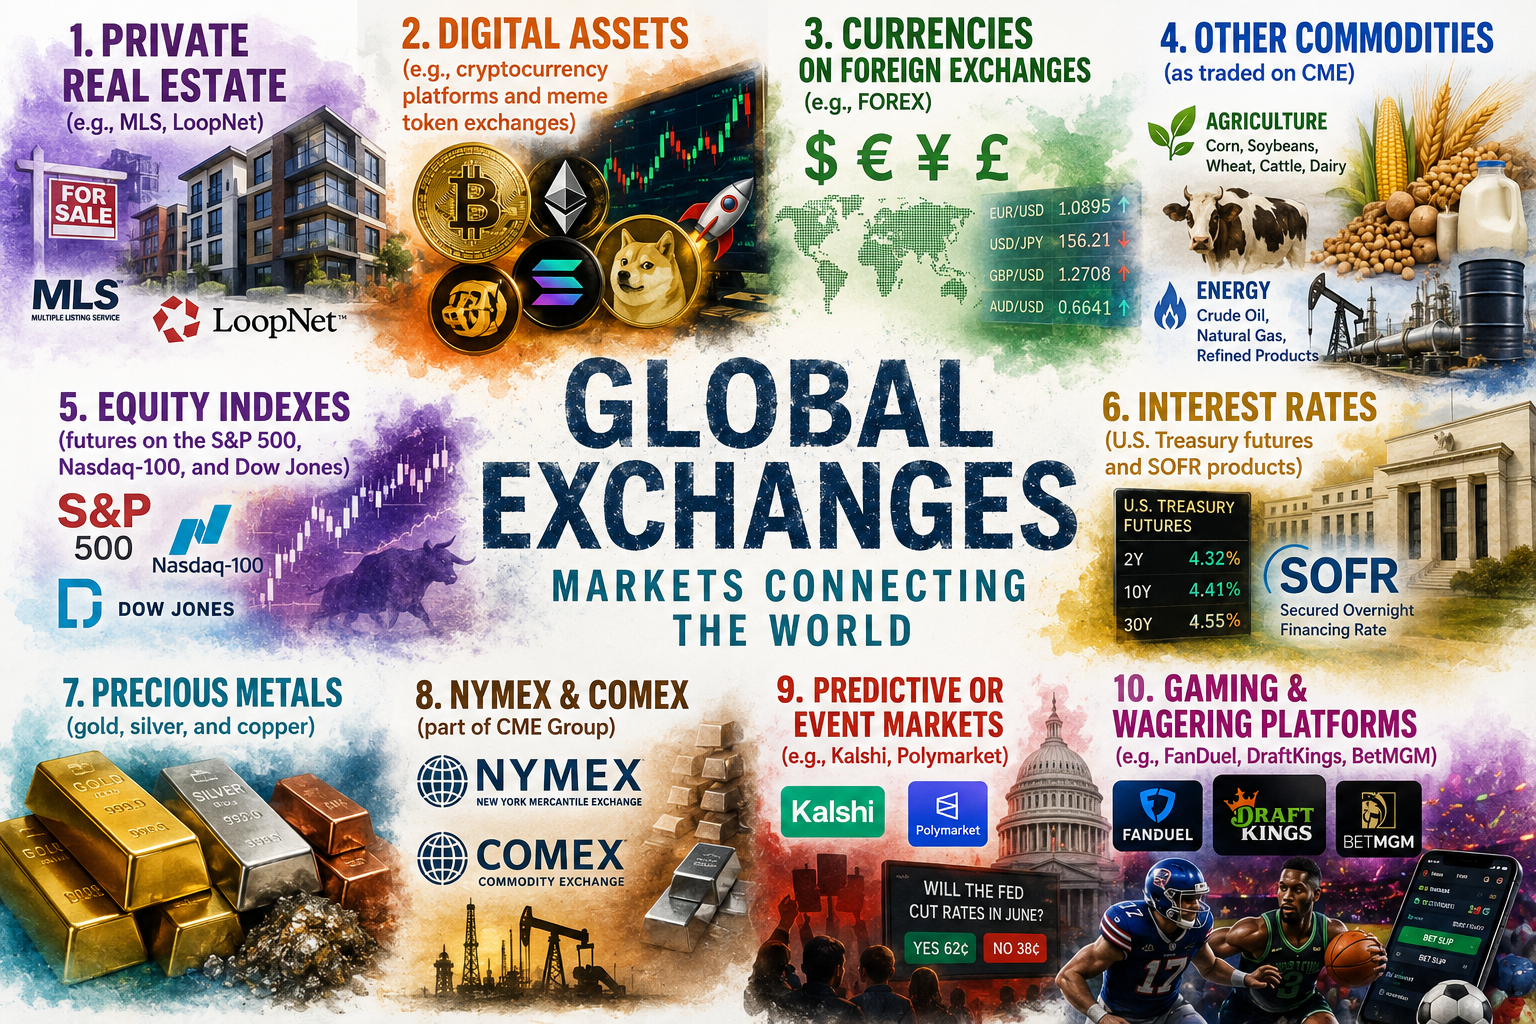
Many known Exchanges were excluded from the original Friday Finance list of global markets. There are many other trading venues and platforms for assets far beyond stocks and bonds that are important to discuss. Some of those platforms are listed below:
1. Private real estate (e.g., MLS, LoopNet), 2. Digital assets (e.g., cryptocurrency platforms and meme token exchanges), 3. Currencies on Foreign Exchanges (e.g., FOREX), 4. Other commodities (as traded on CME including agriculture — corn, soybeans, wheat, cattle, and dairy; energy — crude oil, natural gas, and refined products; equity indexes — futures on the S&P 500, Nasdaq-100, and Dow Jones; interest rates — U.S. Treasury futures and Secured Overnight Financing Rate (SOFR) products; and precious metals — gold, silver, and copper). New York Mercantile Exchange (NYMEX) and Commodity Exchange (COMEX), 5. Predictive or event markets (e.g., Kalshi, Polymarket), 6. Legal Gaming and wagering platforms (e.g., FanDuel, DraftKings, BetMGM).
This Friday Finance post will also explore the often overlooked trading places, and it will venture into some corners of the market where there is little to no light. These more obscure markets are known as the Gray Market and the Black Market. These markets and some other exchanges function on what is known as the Deep Web and Dark Web. Those are venues are functionally separate parts to this particular lesson plan.
A quick but important distinction: these eleven markets aren’t measured in the same way. Some numbers below are STOCK (the total value of everything that exists, at a point in time — like the total worth of every house on Earth). Others are FLOW (the amount that changes hands in a given period — like a stock exchange’s daily trading volume). Comparing a stock number to a flow number is like comparing a bathtub’s total water volume to the flow rate of the faucet — both are “big,” but they’re not the same kind of big. Here we’ve labeled each one.
| # | Market | Best current figure | Stock or Flow? |
|---|---|---|---|
| 1 | Private Real Estate (global) | $393.3 trillion total value (Savills, most recent full-year data) | Stock |
| 2 | Digital Assets (crypto) | ~$2.2–2.3 trillion total market cap (July 2026); ~$58–150B traded per day | Stock (cap) + Flow (volume) |
| 3 | FOREX | $9.51 trillion per day (BIS April 2025 survey, record high) | Flow |
| 4 | CME Group markets — agriculture, energy, equity indexes, interest rates, metals, NYMEX, and COMEX (all part of CME Group) | ~$4 trillion per day in notional value traded, across a record 28.1 million contracts/day in 2025 | Flow |
| 5 | Kalshi + Polymarket | $44.8 billion in June 2026 alone (World Cup peak); more typical months run ~$24–25 billion | Flow |
| 6 | Sports Betting/Wagering (legal, U.S.) | $165.58 billion wagered in 2025, generating $16.80 billion in actual revenue | Flow |
The Math makes these valuations comparable in USD, and prompts discussions on FOREX and CME Group in particular:
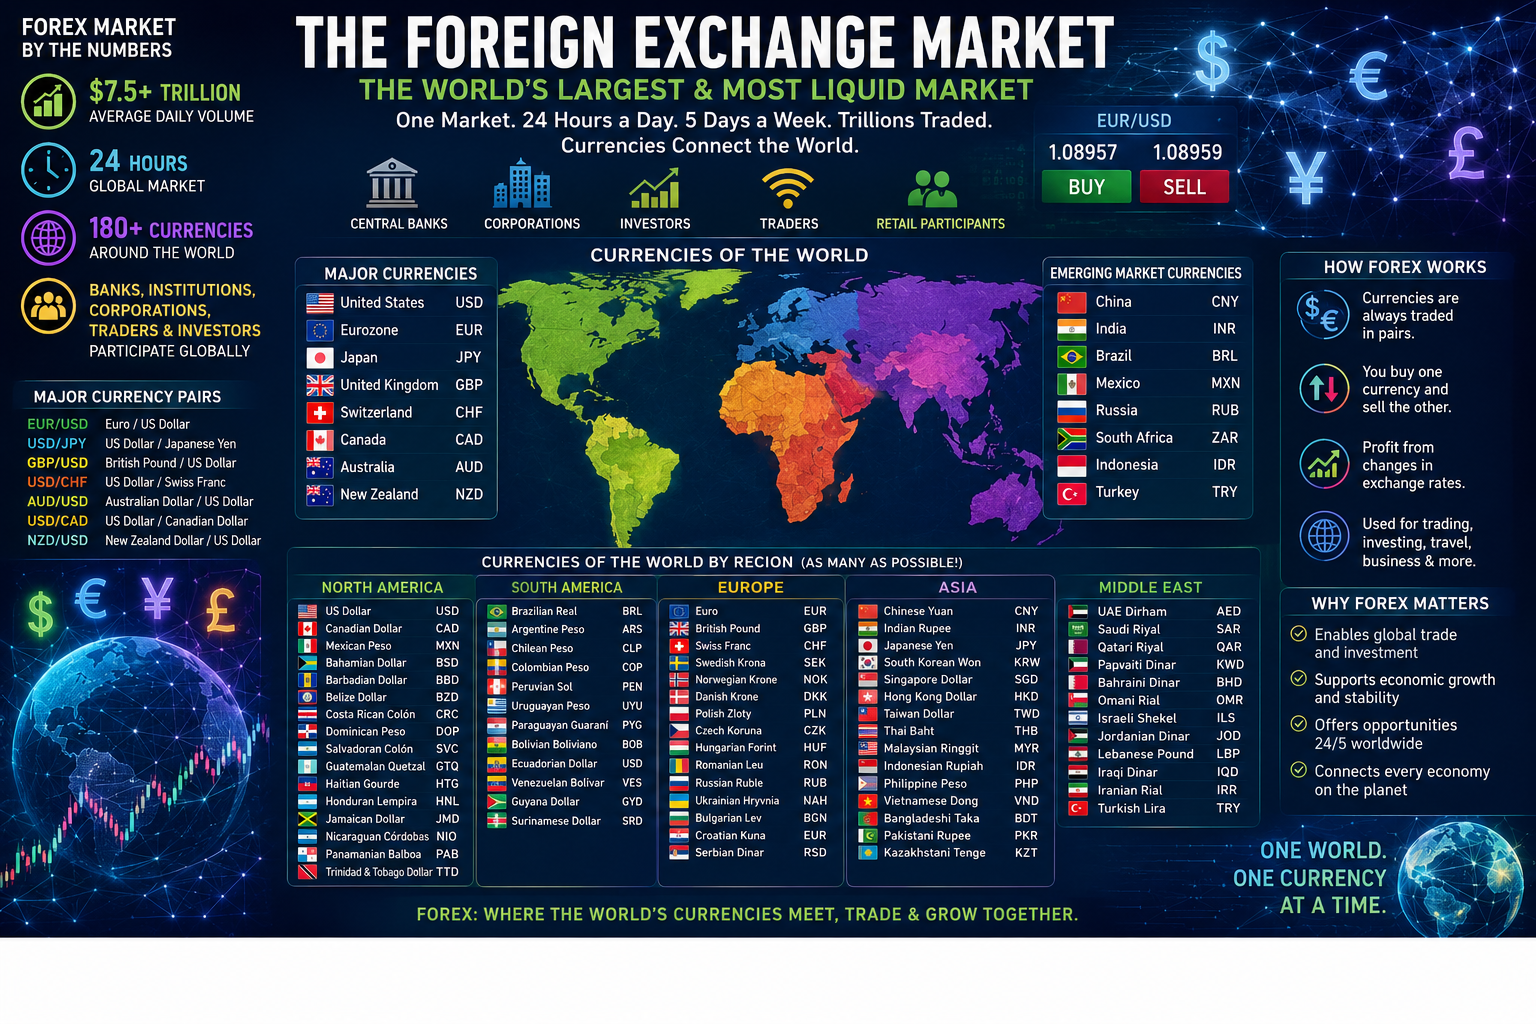
FOREX, annualized: $9.51 trillion/day × 252 trading days ≈ $2.4 quadrillion per year. That’s not a typo — a quadrillion is a thousand trillion. Foreign Currency Exchange (FOREX) alone turns over more money in about 41 days than all global real estate is worth in total. That makes the size of this market the staggering top in the world.
CME Group (items 4–9 combined), annualized: ~$4 trillion/day × 252 trading days ≈ just over $1 quadrillion per year. This one number covers agriculture, energy (NYMEX), metals (COMEX), equity index futures, and interest rate products together, since they’re all traded on the same exchange family. The original Friday Finance post had the CME and the number 3 trading platform (Exchange) in the world, after the NYSE and Nasdaq. With the figures calculated in this post for FOREX and CME Group, the whole Exchange picture is more complicated.
Kalshi + Polymarket, annualized (at the more typical ~$24.5B/month rate, not the World Cup spike): $24.5 billion × 12 ≈ $294 billion per year. And the rate of growth of these two markets in particular is stunning. With the participation and acceptance of (and financial investments in) these trading platforms getting legitimized by the NYSE and Nasdaq, there appears to be no end in sight. “Sky’s the Limit,” as they say.
U.S. Legal Sports Betting: already an annual figure — $165.6 billion wagered, of which sportsbooks actually kept $16.8 billion (a ~10% “hold rate” — the rest gets paid back out to winning bettors).
The Headline Takeaway: FOREX and the CME Group’s combined commodity/financial futures markets aren’t just bigger than everything else on this Exchange list, they’re bigger by orders of magnitude than all of the other exchanges combined. Currency and derivatives markets trade the same underlying value over and over, many times a day, while something like real estate mostly just sits there being owned. That’s exactly why it is important to set them aside for a separate Friday Finance discussion — folding “$1 quadrillion/year in wheat and Treasury futures” into the same chart as “$535 million in real carbon credit trades” would make the small-but-interesting markets that may be immaterial and invisible.
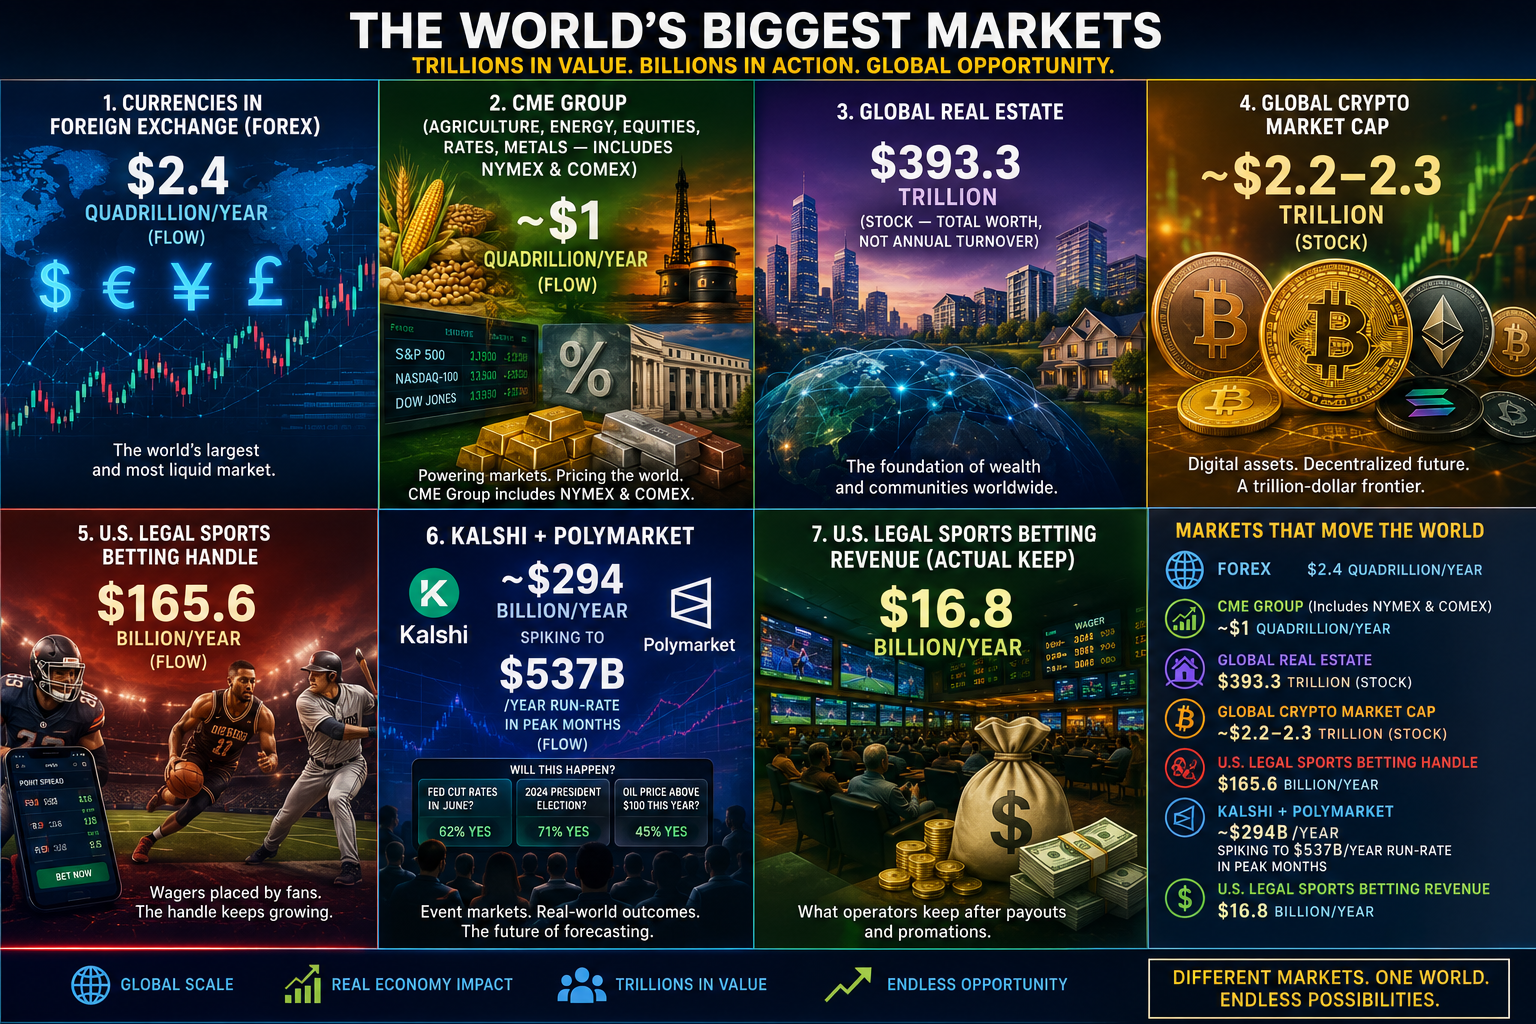
Putting it all on one table with one scale:
| Market | Annualized flow (or stock, noted) |
|---|---|
| Currencies in Foreign Exchange (FOREX) | $2.4 quadrillion/year (flow) |
| CME Group (agriculture, energy, equities, rates, metals — includes NYMEX & COMEX) | ~$1 quadrillion/year (flow) |
| Global real estate | $393.3 trillion (stock — total worth, not annual turnover) |
| Global crypto market cap | ~$2.2–2.3 trillion (stock) |
| U.S. legal sports betting handle | $165.6 billion/year (flow) |
| Kalshi + Polymarket | ~$294 billion/year, spiking to $537B/year run-rate in peak months (flow) |
| U.S. Legal Sports Betting Revenue for venues such as DraftKings, FanDuel, BetMGM, etc. (actual keep) | $16.8 billion/year |
Part A: What’s Missing? (Excluding Stock Exchanges)
Beyond traditional stock exchanges, there are several other sizable “alternative exchange” categories that didn’t make the first cut. These markets are LEGAL and worth knowing about, even if we don’t do a deep-dive into these exchanges today:
- Private company stock secondaries (Forge Global, Nasdaq Private Market): marketplaces for buying and selling shares of companies that haven’t gone public yet. (Valued at $20-40 Billion)
- Litigation finance (Alternative asset niche) (Valued as ~$19–26 B)
- Private credit (Main Stream Adjacent) when the companies are getting support ouside of traditional US banks (Valued at ~$2–3.5 Trillion)
- Fine art & collectibles exchanges (Masterworks, Rally, and the big auction houses Sotheby’s/Christie’s) — platforms that let investors buy fractional shares of paintings, or trade whole pieces of art like a stock. (Valued at $60-70 B)
- Sports memorabilia & trading card markets (PWCC, Goldin, Fanatics Collect) — a multi-billion-dollar grading-and-resale economy for cards, jerseys, equipment and autographs. (Valued at $10-15 B)
- Sneaker & streetwear resale (StockX, GOAT) — real-time “exchanges” for limited-edition sneakers, functioning almost like a stock ticker for shoes. (Valued at $10-20 B)
- Wine & whiskey cask exchanges (Liv-ex and similar platforms) — trading of investment-grade wine and aging whiskey casks. (Valued at $8-12 B)
- Life settlements market — a market where people sell their life insurance policies to investors for a lump sum while still alive. (Valued at $4-6 B)
- Insurance-linked securities / catastrophe bonds — a way for investors to essentially “insure the insurers” against hurricanes, earthquakes, etc., in exchange for high yields. (Valued at $15-20 B annually)
- Water rights markets — increasingly formalized trading of water access rights, especially in the western U.S. It is a highly fragmented market in other parts of the world, such as Australia, Chile and Spain. (there’s even a Nasdaq water futures index now, though that edges toward the CME-adjacent commodities that are already excluded in the Friday Finance analysis) (Valued at $5-10 B).
- Voluntary Carbon Market (VCM) (Valued at $1.5–2.5 B)
- Compliance Carbon Credit Markets (CCCM) (Valued at $900 B–$1.1 T)
We will come back to these topics in future Friday Finance posts should there be an interest in pursuing them.
Part B: Wagering Markets — Kalshi, Polymarket, and Legal Sports Betting
A quick vocabulary check on the Math
You’ll see the word “volume” a lot below. On a betting or trading platform, volume means the total dollar amount wagered or traded, not profit and not the size of some underlying pool of money. It’s more like a store’s total sales in a year, not its bank account balance. Keep that distinction in mind — a platform can have huge volume and still be a small company.
Prediction Markets: Kalshi and Polymarket
Prediction markets let people buy contracts betting on the outcome of real-world events: e.g. Will it rain in your city tomorrow? Will a bill pass Congress? Who wins the World Cup? A contract that pays out $1.00 if you’re right is priced somewhere between $0.01 and $0.99 today; that price is basically the market’s built-in guess at the probability (a 60-cent contract implies a 60% chance).
This category has exploded:
| Month | Kalshi volume | Polymarket volume | Combined |
|---|---|---|---|
| Sept 2025 | — | — | under $5 billion |
| Dec 2025 | $6.38 billion | — | — |
| Feb 2026 | $9.8 billion | $7.0 billion | — |
| Apr 2026 | — | — | ~$24 billion |
| May 2026 | $17.91 billion | $7.08 billion | — |
| June 2026 (World Cup month) | $31.5–$44.8B** | $10.8 billion | $44.8 billion |
Doing the Math — what’s the annualized run-rate?
If we took the “normal” (non-World Cup) combined monthly volume of around $24–25 billion (April 2026’s pace) and simply multiplied by 12 months: $24.5 billion × 12 = ≈$294 billion per year in notional trading volume, before the added World Cup surge.
That’s a rough estimate, not a forecast. Prediction markets are growing so fast month-to-month that any annualized number is stale within weeks. For comparison, Kalshi’s 2025 growth rate was reported at 1,108% year-over-year, which is an extraordinary pace for any financial exchange.
What are these companies actually worth? To break down the summative numbers from above, as of mid-2026: Kalshi was valued at $22 billion after a $1 billion funding round in May 2026, and had generated roughly $1.15 billion in cumulative fee revenue since launch (about $850 million of that in 2026 alone). Polymarket was raising at a $15 billion valuation, backed in part by a $600 million investment from Intercontinental Exchange or ICE (this is the company that owns the New York Stock Exchange) — itself a sign that “serious” finance organizations now sees prediction markets as a legitimate category, not a novelty.
Legal Sports Betting (DraftKings, FanDuel, BetMGM, etc.)
For comparison, the more familiar U.S. sports betting industry:
- 2025 legal U.S. handle (total wagered): $165.58 billion
- 2025 legal U.S. revenue (what the books actually kept, “GGR”): $16.80 billion
- Global legal sports betting revenue (2025): roughly $111.2 billion, projected to reach $123.4 billion in 2026
Notice something interesting: the U.S. legal sportsbooks’ handle ($165.58B) is more than 5x larger than their revenue ($16.80B) — the “hold rate” (the cut the house actually keeps) is only about 10%. That’s a useful number to compare against prediction markets, where the entire notional volume isn’t the company’s earnings either — Kalshi’s $31.5 billion June 2026 volume produced something on the order of tens of millions in that month’s fee revenue, not billions.
The Illegal / Offshore Sports Betting Market
Here’s where the numbers get genuinely disputed — nobody regulates or discloses illegal betting activity, so every estimate is a modeled guess, and different groups have very different incentives in how they model the illegal component of their market:
| Source | Estimated illegal U.S. handle | Estimated illegal U.S. revenue |
|---|---|---|
| American Gaming Association (Aug. 2025) | $84 billion | $5 billion |
| JMP Securities / Citizens (2024 data) | $163 billion | $9.8 billion |
| Blask/Next.io search-trend model (2025) | up to ~$300 billion | not estimated |
| Some industry lobbying claims cited in press | up to ~$450 billion | not estimated |
The American Gaming Association — an industry trade group with a financial interest in showing the illegal market as large (to support arguments for legalizing betting in more states) — also estimates that all illegal and unregulated gambling in the U.S. (offshore sports betting, unlicensed online casinos, and unregulated slot-style machines in bars and convenience stores) adds up to $673.6 billion wagered annually, generating $53.9 billion in revenue for operators and costing state governments about $15.3 billion a year in lost tax revenue.
A Financial-Literacy Lesson here: when you see a headline statistic about an illegal or unregulated market, always ask who produced this estimate, and what’s their incentive? A trade association lobbying state legislatures for expanded legal betting benefits from a bigger “illegal market” number. That doesn’t make the estimate wrong — but it’s a reason to look for a range of independent sources rather than trusting a single number.
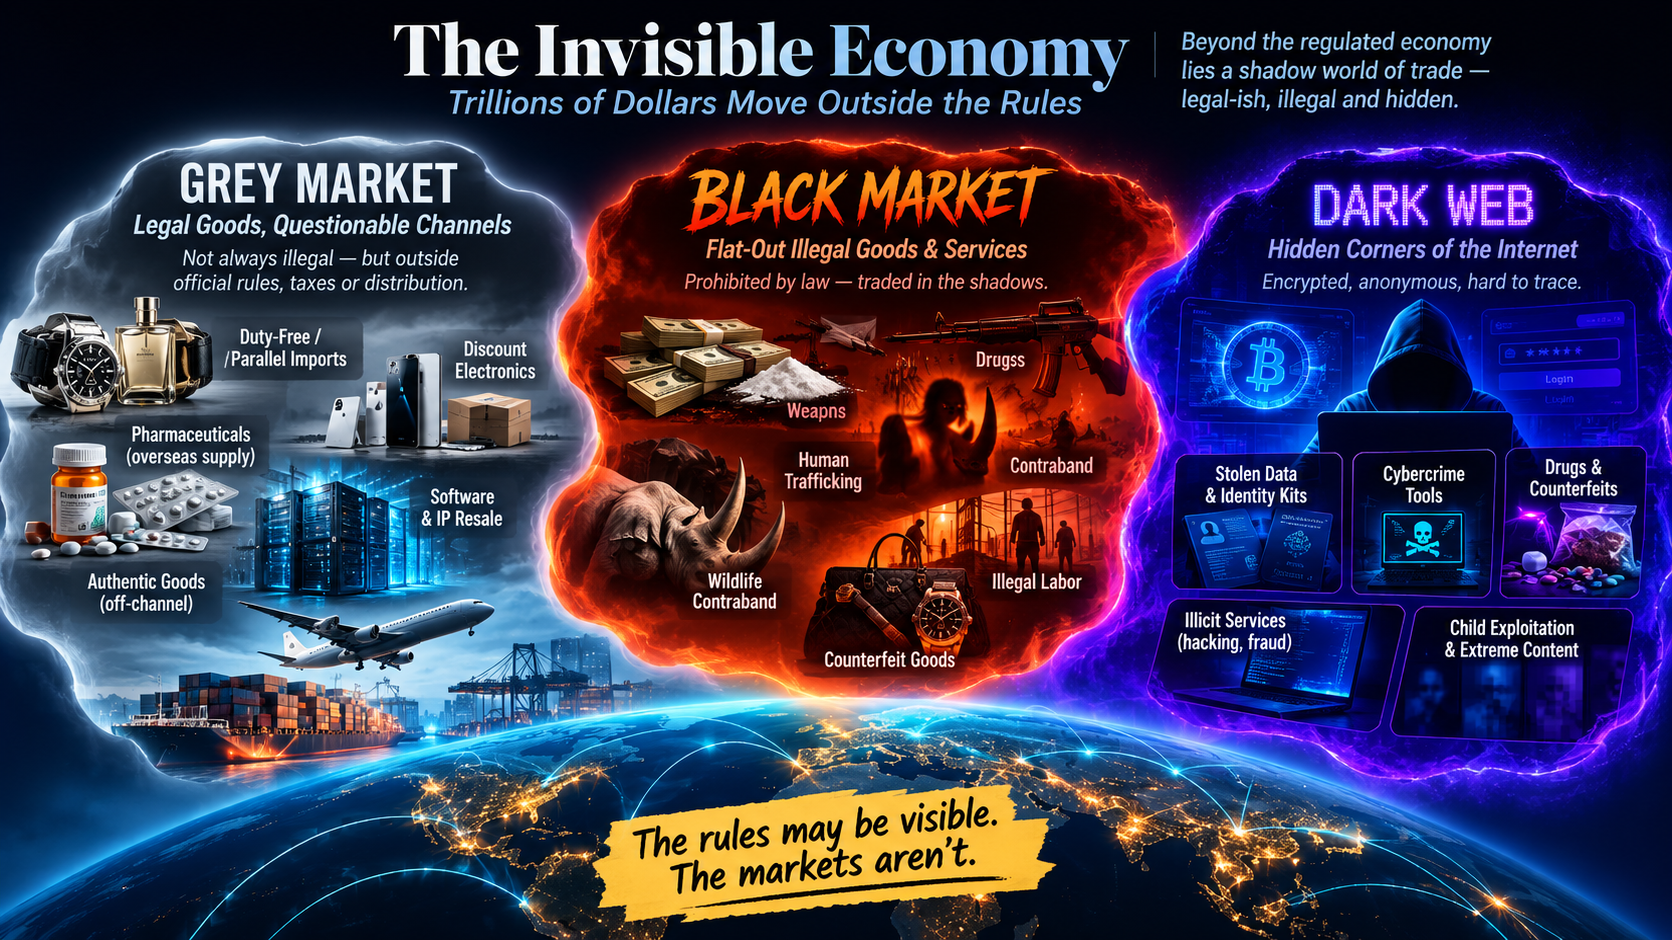
Part C: Gray Markets: Unauthorized Commerce Outside the Official Channels
A Gray Market consists of goods and services that are themselves legal but are bought, sold or distributed through channels not authorized or intended by the original manufacturer, producer, or regulator. Unlike black markets, gray markets generally do not involve products that are illegal to possess. Instead, they exploit differences in pricing, regulation, geography, or distribution agreements. The products are genuine; the sales channel is what falls outside the established rules.
Gray markets arise because economic incentives encourage entrepreneurs to move products from places where they are inexpensive to places where they command higher prices. These products and services are a product of geographic arbitrage. A smartphone intended for sale in Singapore may be imported into the United States without the manufacturer’s approval and sold for a higher profit. Pharmaceuticals approved for one country’s healthcare system may be diverted to another market. Event tickets may be resold at prices above legal caps, and software licenses may be transferred outside their authorized territories. In many jurisdictions, so-called “skill gaming” machines occupy another gray area by operating under legal interpretations that distinguish games of skill from games of chance or gambling.
Counterfeit goods deserve special mention because they often blur the line between gray and black markets. The counterfeit product itself is illegal, making its sale part of the black market, yet counterfeit merchandise frequently travels through distribution channels that resemble otherwise legitimate gray-market wholesalers and retailers. The OECD and EUIPO estimate that global trade in counterfeit and pirated goods approaches $467 billion annually, illustrating how difficult it can be to distinguish unauthorized commerce from outright criminal enterprise.
Part D: Black Markets: Commerce That Is Illegal by Definition
A Black Market exists whenever the goods, services, or transactions themselves are prohibited by law. Unlike gray markets, where the products are generally lawful but sold through unauthorized channels, black markets involve commerce that governments have declared illegal because of concerns over public safety, taxation, licensing, national security, or criminal activity.
The black market encompasses a broad range of activities, including illegal narcotics, human trafficking, arms smuggling, wildlife trafficking, counterfeit currency, stolen property, forced labor, illegal gambling, and numerous forms of organized crime. These markets thrive because demand continues despite legal prohibitions, creating opportunities for criminal organizations willing to assume significant legal risk in exchange for high profits.
Because participants intentionally conceal their activities, estimating the size of black markets is exceptionally difficult. The United Nations Office on Drugs and Crime has estimated that organized crime generates approximately $2.1 trillion annually, while the International Labour Organization estimates that forced labor and human trafficking alone generate $236 billion in illegal profits each year. Estimates for the global illegal drug trade range from well under $100 billion to more than $600 billion, reflecting the inherent uncertainty of measuring economic activity that is designed to remain invisible.
Part E: The Dark Web: Anonymous Marketplace Infrastructure
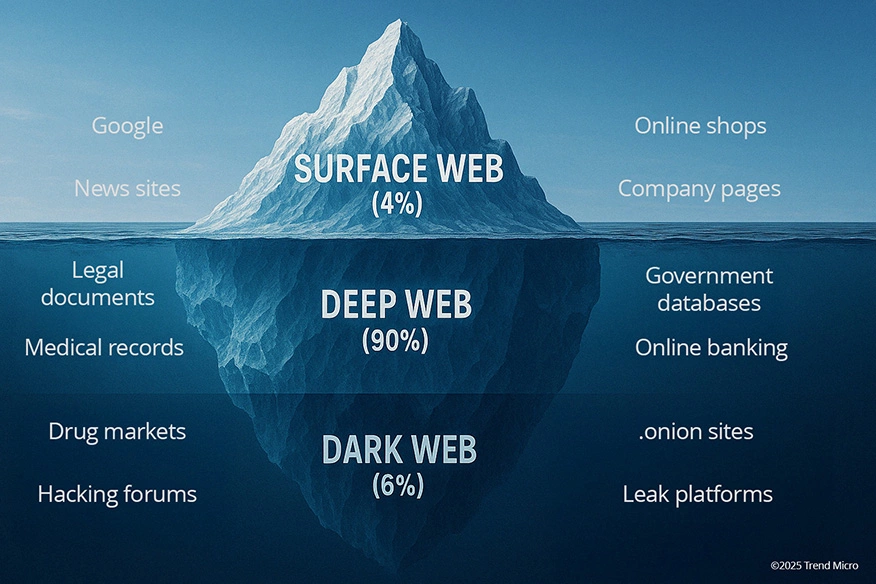
The Dark Web is not a market category at all. Rather, it is a technological infrastructure that allows users to communicate and conduct transactions anonymously over encrypted networks such as Tor. Whereas the surface web consists of websites indexed by search engines and the deep web includes private databases and password-protected content, the dark web contains sites intentionally hidden from ordinary browsers and accessible only through specialized software.
Importantly, the dark web itself is not inherently illegal. Journalists, political dissidents, intelligence agencies, whistleblowers, and privacy advocates use it for entirely legitimate purposes. Its defining characteristic is anonymity—not criminality.
The dark web becomes economically significant because it provides an anonymous platform on which many forms of commerce can occur. Some activity is perfectly lawful, including secure communications, anonymous publishing, privacy-focused discussion forums, and protected information sharing. At the same time, anonymous marketplaces have become popular venues for illegal commerce. Drugs, stolen financial information, counterfeit identification documents, malware, ransomware services, hacking tools, and other cybercrime-related products are frequently advertised on these platforms. In other words, the dark web hosts portions of both the gray and black economies, but it is not itself synonymous with either one.
Researchers estimate that identifiable darknet marketplace sales total only a few billion dollars annually—roughly $2–3 billion in recent years. This is surprisingly small compared with the much larger global black-market economy, which measures in the trillions of dollars. Most organized crime still operates through traditional offline networks, conventional financial systems, encrypted messaging apps, and informal cash transactions rather than dedicated dark web marketplaces. The dark web should therefore be viewed as one specialized venue within the broader invisible economy rather than as the invisible economy itself.
Putting the Invisible in Perspective
| Market | Best current estimate | Type |
|---|---|---|
| Litigation finance | ~$19–26 billion | Legal, niche alternative asset |
| Private credit | ~$2–3.5 trillion | Legal, mainstream-adjacent |
| Voluntary carbon credits, real trades | ~$535 million (2024) | Legal, small but symbolically important |
| Kalshi + Polymarket, annualized run-rate | ~$294 billion+ (notional volume, not revenue) | Legal (regulated) |
| U.S. legal sports betting (handle) | $165.6 billion (2025) | Legal (regulated) |
| Global legal sports betting (revenue) | $111–123 billion | Legal (regulated) |
| U.S. illegal/unregulated gambling (all forms) | $673.6 billion wagered / $53.9B revenue | Gray/black |
| Global counterfeit goods trade | $467 billion | Gray/black |
| Global illegal drug trade | $320 billion–$652 billion (wide range) | Black |
| Global organized crime proceeds (all forms) | ~$2.1 trillion | Black |
| Forced labor/trafficking profits | $236 billion | Black |
The biggest number on this entire list — $2.1 trillion in global organized crime proceeds — is in the same neighborhood as the entire legitimate private credit market, one of the largest legal “alternative” asset classes in the world. That’s a sobering comparison, and it’s exactly why economists, the UN, and law enforcement agencies keep trying (imperfectly) to measure it: understanding the scale of illegal markets is a first step toward disrupting them.
A note on this section: the figures above are drawn from published research by organizations like the UN Office on Drugs and Crime, the International Labour Organization, the OECD, and the American Gaming Association. They’re shared here purely as economic and educational context — the same way a textbook would cite crime statistics — not as guidance on accessing any of these markets.
Sources
- Pew Research Center, “Trading volume on prediction markets has soared in recent months” (May 27, 2026)
- The Block / DeFi Rate prediction market volume trackers
- CNBC, “2026 FIFA World Cup boosts prediction market volumes” (July 2026)
- Value Add VC, “Kalshi vs Polymarket: $22B vs $15B Valuation” (2026)
- RG.org, “U.S. Sports Betting Statistics July 2026”
- Grand View Research, Sports Betting Market Report 2026–2033
- American Gaming Association, “Sizing the Illegal and Unregulated Gaming Markets” (Aug. 2025 / March 2026 update)
- Birches Health / JMP Securities, offshore sports betting estimates
- OECD/EUIPO, “Mapping Global Trade in Fakes 2025”
- UNODC, “Illicit money: how much is out there?” and World Drug Report data
- Global Financial Integrity, “Transnational Crime and the Developing World”
- International Labour Organization, forced labor profit estimates (2014 and 2024)
- Research and Markets, Litigation Funding Investment Market Report 2026
- Mordor Intelligence, Litigation Funding Investment Market
- Burford Capital, 4Q25 and FY25 Financial Results (PRNewswire, Feb. 26, 2026)
- Mordor Intelligence & Global Market Insights, Private Credit Market reports (2026)
- McKinsey, “Private credit in 2025: A maturing industry navigates change”
- Percent, 2026 Private Credit Outlook and 2025 Year in Review
- Forge Global Holdings, Q1 & Q2 2025 earnings releases
- Ecosystem Marketplace, State of the Voluntary Carbon Market 2025
- Center for Sustainable Finance, “The State of Carbon Markets — 2025 Review”
- Carbon Credits, “The Top Carbon Credit Exchanges Driving Climate Markets in 2026 and Beyond”
- Business Wire, “2021 Xpansiv Carbon Volume Rises 288%”
Data currency note: figures reflect the most recent full-year (2025) or latest-quarter results available as of July 2026. Market-size projections vary significantly by research firm; ranges are shown where estimates diverge meaningfully.

