

While it is surprisingly tricky to nail down exactly where our tax dollars are going (state, local, federal), it is critical to pause and take a hard look. The first step is to see where those dollars are deployed. There are a lot of different ways that states allocate the taxes paid by their residents and visitors, and there may also be lots of countries in the world who spend taxes in ways that may suit you better than the U.S. We hear about federal taxes in the debates on Capitol Hill, but what does that mean to our own pocketbooks?
We have explorecd the Consumer debts out there, which challenge consumers to spend their income and investments wisely. Now it is time to turn our attention full to the federal government.
This Friday Finance post is inclusive of the Federal taxes only. As I often say to the personal finance students, if we don’t like how our taxes are spent, and you don’t intend to run for public office, there are two clear ways to make changes: (1) vote for the person or party or policies which spend taxes where you want the money to go, or (2) move.
This post will assume that you want to stay in the U.S. At the same time, you may want clarity on how federal taxes are spent from the point of view of the average consumer.
Here’s a Top-Down Look (FY2025)
The figures below combine two federal data sets: (1) CBO’s (Congressional Budget Office) final cash-basis outlay totals for FY2025 (the government’s fiscal year ran Oct 1, 2024–Sept 30, 2025), and (2) the U.S. Treasury’s accrual-based “Statement of Net Cost” by agency, the most granular official breakdown available, current through FY2024 final data. Wherever FY2025-specific appropriations numbers exist for a department, those are noted as well. Because of this mix of cash outlays, accrual costs, and appropriated budget authority, remember to treat the figures as best-available estimates, not a single reconciled ledger.
Please note: no single government report shows all of our taxes on one page.
1. The Big Picture
| Metric | FY2025 |
| Total federal outlays (spending) | $7.01 trillion |
| Total federal revenue | $5.24 trillion |
| Deficit | $1.78 trillion |
| Spending as % of GDP (gross domestic products) | ~22–23% |
| Mandatory spending (autopilot — no annual vote) | ~$5.1 trillion (~73%) |
| Discretionary spending (Congress votes on it yearly) | ~$1.9 trillion (~27%) |
The core structural fact: almost three-quarters (~73%) of the federal budget isn’t something Congress debates each year. It’s paid out automatically under permanent law. These agencies/payments include Social Security, Medicare, Medicaid, other entitlements, and interest on the debt. The annual Congressional and Senatorial fights over “the budget” you see in the news are mostly fights over the remaining quarter (~27%) of the overall budget. And many Republicans, for example, throw the spending in the DoD into the mandatory camp, which raises those spending sums to be ~85% of the budget.
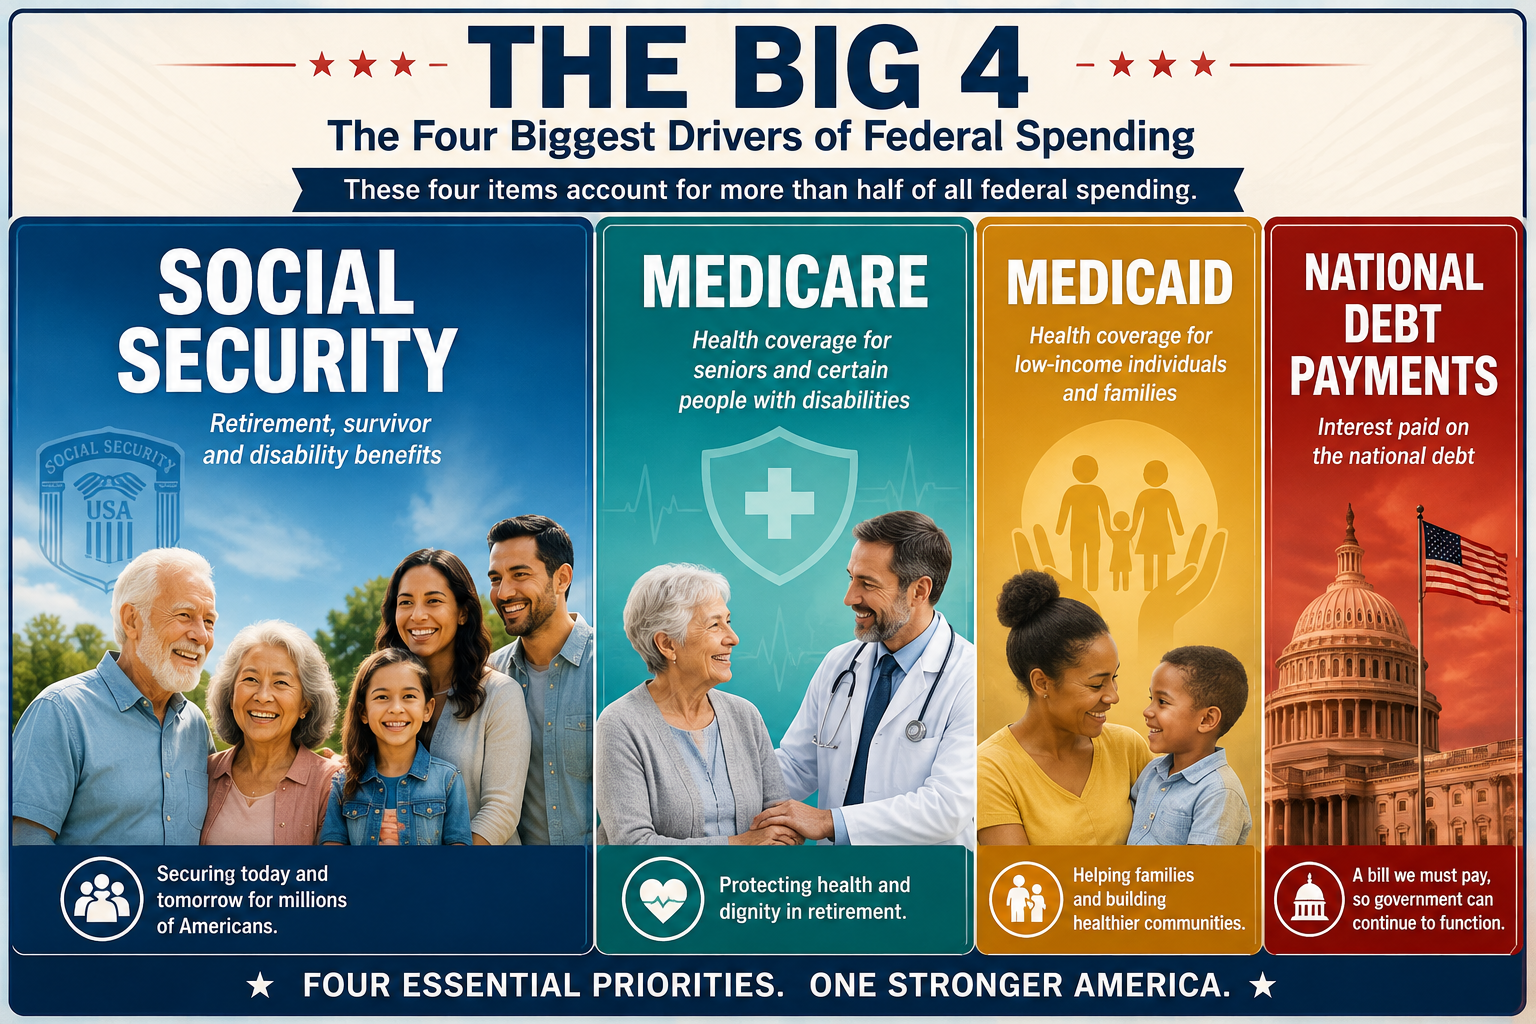
2. The Big Four Mandatory Programs
These four items alone, known as “federal entitlements,” account for roughly 55–60% of all federal spending.
| Program | FY2025 Outlays (approx.) | What is it? |
| Social Security | ~$1.6 trillion | Retirement, survivor, and disability benefits for ~70 million people, funded by payroll (FICA) taxes. Administered by the Social Security Administration (SSA), an independent agency. |
| Medicare | ~$950 billion–1.0 trillion | Health coverage for ~67 million people age 65+ and some younger people with disabilities. Administered by HHS’s Centers for Medicare & Medicaid Services (CMS). |
| Medicaid | ~$620–630 billion (federal share) | Health coverage for ~72 million low-income Americans, jointly funded with states. Also run by CMS within HHS. |
| Net interest on the debt | >$1 trillion (first time ever in FY2025) | Interest owed on the $36+ trillion national debt. Not a program — a bill that has to be paid regardless of policy priorities. It now exceeds the combined spending on Veterans Affairs, Education, Transportation, Homeland Security, Energy, and Agriculture. |
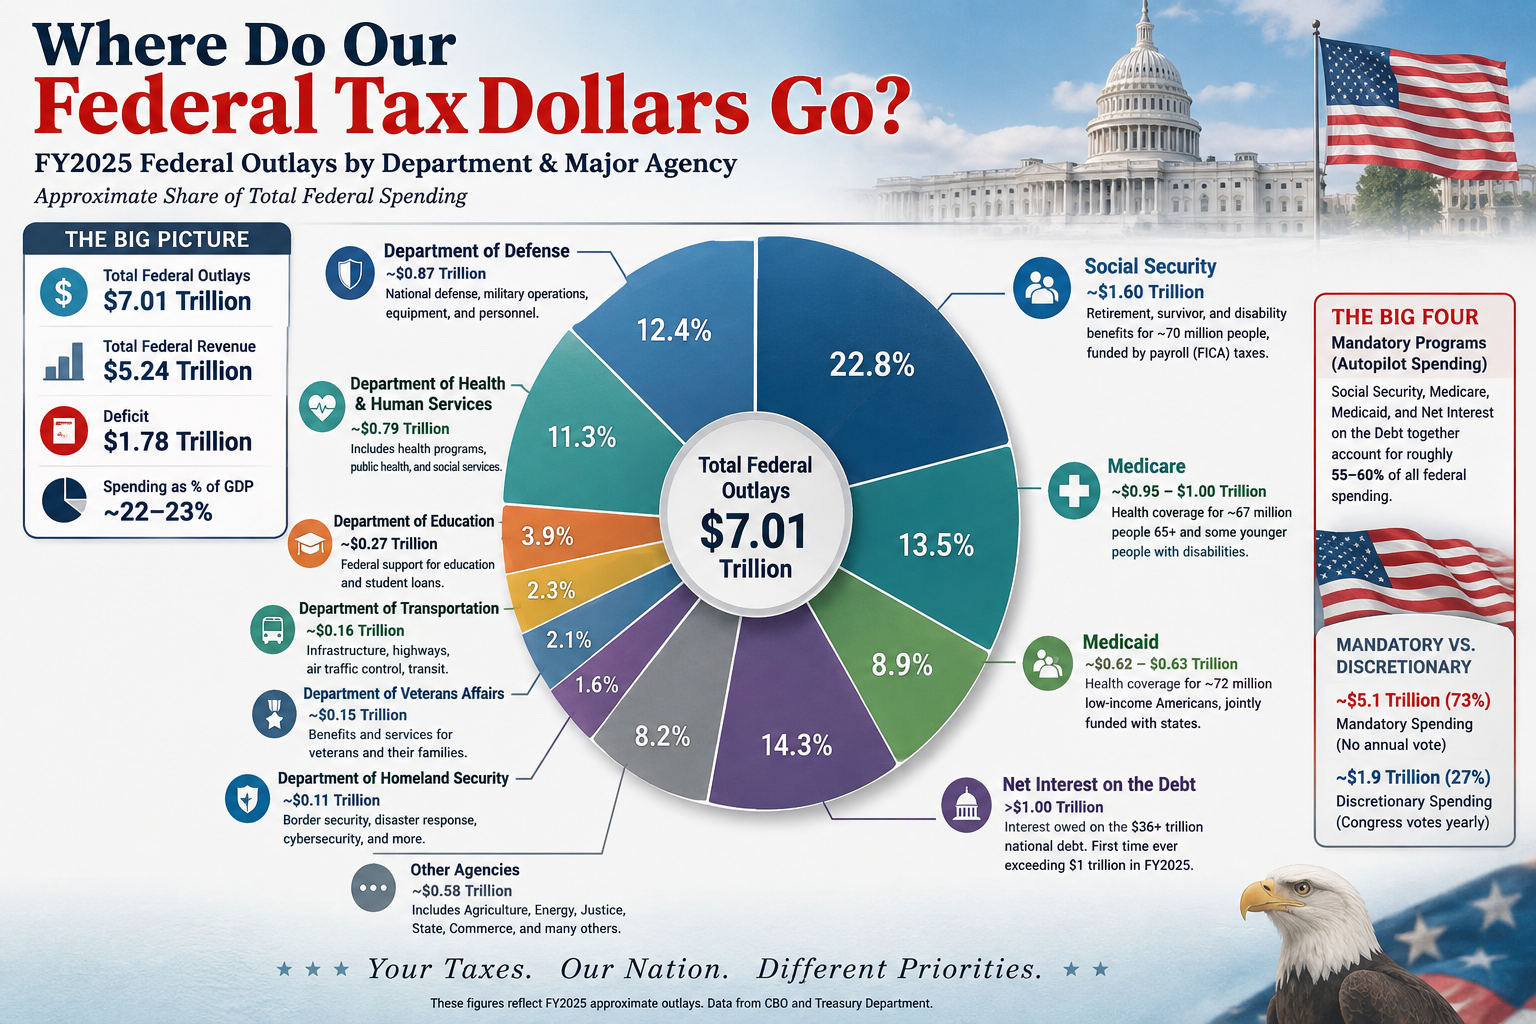
3. Federal Spending by Cabinet Department & Major Agency
Figures are Treasury’s FY2024 gross/net cost (the latest complete agency-level accounting) unless a more specific FY2025 appropriated figure is noted. Net cost = gross cost minus fees, offsetting collections, and similar revenue the agency brings in itself.
| Rank | Department / Agency | FY2024 Net Cost | Cabinet Mission (brief) |
| 1 | Health & Human Services (HHS) | ~$1.74 trillion | Runs Medicare and Medicaid (85% of its budget), plus the CDC, NIH, FDA, and public health programs. The single largest federal spending agency. |
| 2 | Social Security Administration (SSA) | ~$1.53 trillion | Independent agency (not Cabinet-level) paying retirement, survivor, and disability benefits. |
| 3 | Defense (DOD – Dept of War) | ~$1.06–1.23 trillion | Military services, operations, personnel, procurement, and R&D. Protects U.S. national security interests at home and abroad. FY2025 DoD military-activity outlays alone were ~$868B. |
| 4 | (Net interest — not an agency) | >$1 trillion | Debt Service, described above, is a payment due not a Federal Agency. |
| 5 | Veterans Affairs (VA) | ~$472 billion | Healthcare, disability compensation, pensions, and benefits for veterans. Nearly doubled since FY2019, driven by the PACT Act (toxic-exposure benefits) and rising healthcare use. |
| 6 | Treasury | ~$222 billion | Manages federal finances, collects taxes via the IRS, issues currency, manages the public debt, and administers economic sanctions. |
| 7 | Agriculture (USDA) | ~$203 billion | Primarily funds SNAP (food stamps) and other nutrition assistance, plus crop insurance, farm subsidies, rural development, and food safety (meat/poultry inspection) and national forests. |
| 8 | Education | ~$192 billion | Federal student aid/loans, Title I funding for low-income K-12 schools, special education grants (IDEA), and civil rights enforcement in schools. Direct federal control over K-12 is limited; most funding flows directly to states and districts. |
| 9 | Office of Personnel Management (OPM) | ~$200 billion* | *Includes a large actuarial adjustment for federal employee retirement and health benefits — this is the government’s HR/benefits arm, not a service agency most people interact with. |
| 10 | Transportation (DOT) | ~$115 billion | Federal Highway Admin. (road/bridge funding), FAA (air traffic control, aviation safety), Amtrak subsidies, and transit grants. |
| 11 | Homeland Security (DHS) | ~$101 billion (FY2024) → $191 billion enacted for FY2025–2027† | Border security (CBP), immigration enforcement (ICE), TSA airport screening, the Coast Guard, Secret Service, and FEMA disaster response. †A July 2025 reconciliation law gave DHS an unprecedented multi-year surge — ICE alone got a ~$75billion supplemental on top of its ~$10 billion base budget, and CBP received tens of billions for border wall construction and personnel. |
| — | Justice (DOJ) | ~$38–39 billion (FY2025 appropriated) | FBI, federal prosecutors (U.S. Attorneys), DEA, U.S. Marshals, civil rights and antitrust litigation, and the Bureau of Prisons (federal prison system, historically ~$8–9 billion of DOJ’s total). |
| — | State Department | ~$60 billion (FY2025, with Foreign Operations) | Diplomacy, embassies, foreign aid, and international organization dues (e.g., UN). Often politically prominent but a small slice of the budget (~1%). |
| — | Interior (DOI) | ~$15 billion (Title I, FY2025-26 range) | Manages public lands: National Park Service, (BLM) Bureau of Land Management, Fish & Wildlife Service, Bureau of Indian Affairs, USGS, and offshore/onshore energy leasing. |
| — | Energy (DOE) | ~$51–52 billion | Nuclear weapons stockpile maintenance and cleanup, national laboratories, energy research, and strategic petroleum reserve. |
| — | Labor (DOL) | ~$13–14 billion discretionary (much larger with mandatory unemployment insurance) | Enforces wage/hour and workplace safety law (OSHA), runs job training programs, and oversees Unemployment Insurance and pension protections (PBGC). |
| — | Housing & Urban Development (HUD) | ~$70 billion (FY2025 enacted) | Rental assistance (Section 8), public housing, homelessness grants, and FHA mortgage insurance. |
| — | Commerce | ~$11.5 billion | Census Bureau, NOAA (weather/climate), Patent & Trademark Office, and export promotion. |
| — | Environmental Protection Agency (EPA) | ~$9.1 billion | Independent agency enforcing clean air/water laws, Superfund cleanups, and pesticide/chemical safety regulation. |
| — | Homeland Security’s portion of FEMA | ~$22.7 billion disaster relief fund alone (FY2025) | (Listed separately for visibility; it’s a DHS component, not standalone. Handles federal disaster response and the National Flood Insurance Program.) |
Note: Not every one of the 15 Cabinet departments has a clean, current FY2025 net-cost figure publicly available in one place; several above use FY2025 appropriated budget authority instead, which is a different (and generally larger, since it includes multi-year money) measure than a single year’s outlays. Those bottom nine (9) departments, beyond the top 11, account for a total of ~$276 billion of the FY2025 budget.
4. Discretionary vs. Mandatory Spending — Why It Matters
- Mandatory (~73%): Social Security, Medicare, Medicaid, veterans’ benefits, federal retirement, and interest. Changing these requires Congress to change the underlying law, notsimply pass a budget.
- Discretionary (~27%): Everything Congress appropriates fresh each year — defense, education, national parks, the FBI, foreign aid, EPA, NASA, etc. This is the part of the budget actually fought over in annual appropriations bills and shutdown standoffs — but it’s a minority of total spending.
This is why proposals to “cut the budget” by trimming foreign aid (USAID) or a single agency (Dept. of Education) rarely move the needle much: those programs are often well under 1% of total spending each, while the structural drivers of long-term deficits are the entitlements and interest payments categories listed above.
5. Footnote: Fraud, Earmarks, Waste & Improper Payments
This is genuinely one of the more interesting and contested corners of federal accounting. And while politicians and pundits have felt that it is easy to take a chainsaw to eliminate the waste, rarely is it that simple. There seems to be a lot of pork sloshing around in DC.
- GAO’s official “improper payments” estimate (payments that shouldn’t have been made, or were made in the wrong amount — includes error, not just fraud) was $162 billion in FY2024, rising to $186 billion in FY2025. Since the government started tracking this in FY2003, the cumulative total is roughly $3 trillion.
- ~84% of FY2024 improper payments were overpayments — money that went out the door and, in many cases, is never recovered.
- Five programs accounted for ~75% of the total: Medicare (~54.3B), Medicaid (~31.1B), the Earned Income Tax Credit, SNAP, and (in FY2024) the pandemic-era Restaurant Revitalization Fund.
- Fiscal year 2023 and 2024 had ~$15-16 billion in Earmarks for certain favored places in the country. While these dollars represent a small proportion of the overall share of discretionary spending (less than 0.2%), there were approximately 7,200 projects from every one of our 50 states.
- The fraud figures understate the real problem. The numbers only covers 64–68 federal programs that agencies have chosen to measure — it explicitly excludes some high-risk programs (e.g., HHS’s Temporary Assistance for Needy Families, some HUD rental assistance) because those agencies haven’t built reliable ways to estimate their own error rates.
- Fraud specifically (a subset of improper payments, requiring willful deception) is estimated separately and much more roughly. GAO’s 2024 modeling put likely annual fraud losses somewhere between $233 billion and $521 billion — a huge range that reflects how hard fraud is to measure directly. OMB has publicly disputed GAO’s methodology as implausible, so treat this range as a contested estimate, not a hard number.
- Litigation/recovery angle: improper payments are separate from money currently tied up in active fraud litigation, False Claims Act settlements, or contractor disputes — no single government-wide tally of “money currently in dispute” exists; that data lives program-by-program (e.g., DOJ’s annual False Claims Act settlement recoveries, which typically run $2–3 billion/year).
Key Caveats
- Outlays ≠ appropriations ≠ cost. “Outlays” is cash actually paid out in the year. “Appropriations/budget authority” is money Congress authorized (may be spent over several years). “Net cost” is an accrual accounting measure that includes things like pension liability changes. The table above mixes these because that’s genuinely how the government reports itself — there is no single authoritative one-line-per-agency cash outlay table published at this granularity.
- FY2025 was an unusual year for DHS/immigration enforcement specifically — a massive, multi-year reconciliation-bill infusion (signed July 2025) means FY2025 DHS appropriated totals look very different from FY2025 DHS outlays, since much of that money will be spent through FY2029.
- All figures are nominal (not inflation-adjusted) and rounded.
References and Sources:
Primary sources:
- Congressional Budget Office (CBO) Monthly Budget Review (FY2025 final)
- U.S. Treasury Statement of Net Cost (FY2024)
- GAO reports:
- GAO-25-107753
- GAO-26-108694
- GAO-25-108172
- CRS budget-in-brief reports for individual departments

